Post

Visualizzazione dei post da dicembre, 2023

ADIDAS Sales Analysis - Prayag Padwal su Medium

Articolo molto utile per capire cos'è, come si fa e a cosa può servire l'analisi dei dati. Partendo dal dataset delle vendite dell'Adidas (scaricabile gratuitamente da kaggle) l'autore ci guida passo passo nella fase di pulizia, trasformazione, analisi e rappresentazione dei risultati. Un buon esercizio potrebbe essere quello di ripetere l'analisi usando strumenti diversi da quelli impiegati (Python + Tableau), ad esempio Knime o Knime + Power BI. In the fiercely competitive world of sports apparel, understanding market trends, consumer preferences, and sales dynamics is crucial for staying ahead. Adidas, a global leader in this industry, is no stranger to these challenges. In this in-depth analysis, we dive into a comprehensive dataset to uncover the hidden patterns and strategies behind Adidas’ sales triumphs. Our exploration reveals fascinating insights into several key aspects: from sales performance and product popularity to regional market variations and effic

Identifying Fast Passers Using Data - StatsBomb

Think about De Zerbi’s Brighton knocking it about deep in their own defensive third, baiting the opposition. It amounts to nothing if they can’t move the ball forwards quickly and accurately when they manufacture an opportunity to do so. But of course, passing the ball quickly, accurately and into more advanced areas of the pitch is not an easy thing to do. Players that can do so reliably and frequently aren’t easy to come by. Which got me thinking…. how can we use data to identify these types of players? Leggi tutto:  https://statsbomb.com/articles/soccer/identifying-fast-passers-using-data/

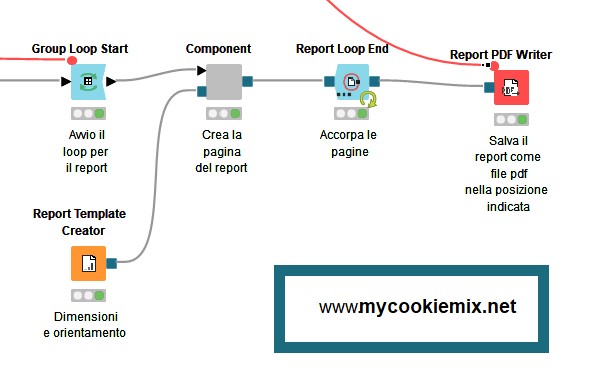
Creare un report in pdf con l'estensione Reporting in Knime

Immagine
Per iniziare, due parole su KNIME "KNIME è una piattaforma open source di analisi dati, reportistica e integrazione. È basata su un'interfaccia grafica drag-and-drop che permette di assemblare nodi per la preprocessazione dei dati (ETL), la modellazione, l'analisi e la visualizzazione dei dati". Più o meno questo è quello che trovi se digiti "cos'è Knime?" su di un motore di ricerca. Io, invece, descriverei Knime con uno strumento (software) che permette di entrare nel fantastico mondo dell'analisi dei dati senza dover necessariamente conoscere un linguaggio di programmazione. Funziona un po' come i mattoncini Lego -  ce ne sono di diverse forme e colori e, unendoli, si possono ottenere astronavi, castelli o macchine da corsa - solo che Knime, al posto dei mattoncini, ha degli oggetti che chiama "nodi" e, unendoli opportunamente, puoi caricare i tuoi dati, analizzarli, trasformarli e farci mille altre cose. Ad esempio: produrre un repo

Building a high-performance data and AI organization - MIT report 2023

«Gli Amministratori Delegati e i Consigli di Amministrazione riconoscono che la capacità della propria organizzazione di generare insight operativi dai dati, spesso in tempo reale, è di massima importanza strategica. Se ci fossero dubbi su questo punto, la corsa accelerata al digitale dei consumatori nell'anno di crisi appena trascorso li ha dissipati. Per aiutarle a diventare orientate ai dati, le aziende stanno sempre più implementando tecnologie avanzate basate su cloud, compresi strumenti analitici con capacità di apprendimento automatico (ML). Tuttavia, ciò che questi strumenti forniscono avrà un valore limitato senza dati abbondanti, di alta qualità e facilmente accessibili. In questo contesto, una gestione efficace dei dati è uno dei pilastri di un'organizzazione orientata ai dati. Ma gestire i dati in un'impresa è altamente complesso. Con l'introduzione di nuove tecnologie dei dati, il peso dei sistemi legacy e dei silos di dati cresce, a meno che non possano es

ARIMA + GARCH: A Hybrid Model to Forecast Highly Volatile Data - Rakesh M K on Medium

Since it is a challenging task to forecast highly anomalous and volatile data like crude price, this page says how to use a hybrid model for the same. ... The model is somewhat able to catch the volatility. But the point to keep in mind is that crude price is affected by many other factors mainly geopolitics. So, it is very difficult to get an accurate prediction of highly volatile and anomalous time series. But hybrid forecasting models may work better than other models since we are considering forecasting the volatility also. Leggi tutto:  https://ai.plainenglish.io/arima-garch-a-hybrid-model-to-forecast-highly-volatile-data-8b2ed0155b34

The Future of Data Visualization: 2024 and Beyond - Mokkup.ai su Medium

As we move into the next era of data-driven decision-making, the field of data visualization is poised for a transformative revolution. With the continuous influx of information and the ever-increasing complexity of data, traditional visualization methods need help to keep pace. Emerging technologies, such as artificial intelligence, machine learning, and augmented reality, are paving the way for a new generation of real time data visualization tools that will enhance our ability to understand complex data and revolutionize how we interact with it. In this article, we will explore the future of data visualization, highlighting key trends and predictions for 2024 and beyond. We will delve into the role of AI and ML in automating data analysis and generating insights, the rise of real-time data visualization, and the increasing adoption of immersive and interactive visualization techniques. We will also discuss the importance of data democratization and the need for tools that empower

La storia dell’algoritmo che ha craccato ChatGPT - Wired

In collaborazione con dei ricercatori dell'Università di Yale, Robust Intelligence ha sviluppato un metodo sistematico che utilizza modelli di AI "avversari" per scoprire i prompt in grado di aggirare le protezioni dei modelli linguistici di grandi dimensioni (Llm), tra cui GPT-4 di OpenAI, e indurli a comportarsi in modo scorretto. Mentre si consumava il dramma presso OpenAI, i ricercatori hanno avvertito la società della vulnerabilità, senza però ricevere risposta. "Questo dimostra che c'è un problema di sicurezza sistematico, che non viene affrontato e non viene preso in considerazione – spiega Yaron Singer, amministratore delegato di Robust Intelligence e professore di informatica all'Università di Harvard –. Quello che abbiamo scoperto è un approccio sistematico per attaccare qualsiasi modello linguistico di grandi dimensioni" . Leggi tutto:  https://www.wired.it/article/chatgpt-craccato-intelligenza-artificiale-robust-intelligence/ In inglese: 

Winning NFL Betting with KNIME, Wind Data and Regression Analysis - Dennis Ganzaroli su Low Code for Data Science

Last time we saw that we could use logistic regression to estimate team ratings based on past results and some extra indicators such as rest days and whether it was a divisional game or not. Furthermore, the additional consideration of wind speed led to a significant improvement of the model. The model improved by 5 percentage points. The full article can be found here: Who is the best team in the NFL? ( https://medium.com/low-code-for-advanced-data-science/who-is-the-best-team-in-the-nfl-b9724cd3deee ) The downside of this additional indicator was that we could not (yet) use it for predictions, as we did not yet have any forecast data available for the weather data. Moreover, the data from nfldata lacked values that we imputed using the mean value of the wind speed. For that reason, this time we will be looking at the automatic collection of wind speed data. Read more:  https://medium.com/low-code-for-advanced-data-science/winning-nfl-betting-with-knime-wind-data-and-regression-analy